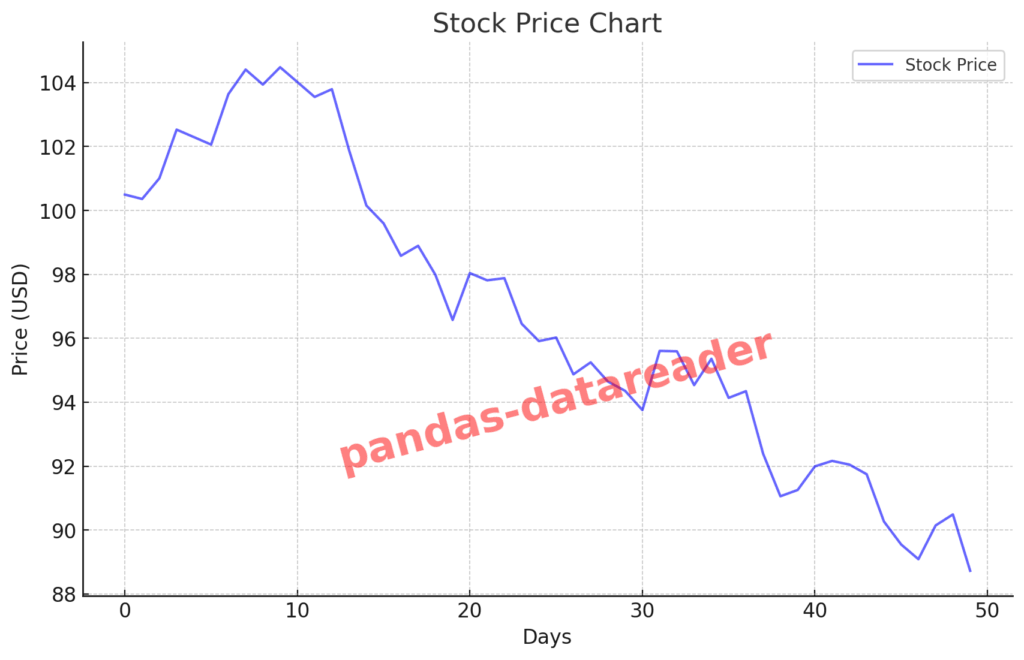
pandas-datareader is a powerful Python library that allows users to easily retrieve financial and economic data from various online sources. It acts as an extension to the popular pandas library and is especially useful for time series analysis, quantitative research, and machine learning pipelines involving economic indicators or market prices.
Originally, data access was part of pandas.io.data, but as of pandas version 0.19.0 (October 2016), this module was officially deprecated and split into a separate package called pandas-datareader. This change was made for several key reasons:
Why Was pandas-datareader Separated?
Minimizing Core Dependencies
The core pandas package focuses on data structures and analysis. By removing API-specific logic, the pandas maintainers reduced external dependencies and simplified the main library.
Improved Maintainability
Since APIs like Yahoo Finance or Google Finance frequently change, separating this functionality into its own package allowed the community to update and patch it independently of pandas releases.
Better Extensibility
With a modular structure, it’s easier to add new data providers—like Alpha Vantage, FRED, Stooq, or even local sources like Naver Finance.
Active Maintenance and Community Updates
As of 2025, pandas-datareader continues to be actively maintained by the open-source community. The project evolves constantly to accommodate changes like:
- API key requirements (e.g., Alpha Vantage, Tiingo)
- Endpoint modifications
- Deprecated services (e.g., Yahoo Finance’s instability)
⚠️ Note: Yahoo Finance often fails or times out due to API changes or throttling. Consider using alternatives like Stooq, Alpha Vantage, or FRED for more reliable data sources.
Purpose and Benefits
Unified Interface
Instead of writing custom code for each data provider, you can use a single, consistent API to access multiple sources. This significantly reduces code complexity for data collection and integration.
Efficient Research and Modeling
In financial analysis, machine learning, or academic research, getting accurate and historical data is a repeated task. pandas-datareader allows quick access to structured data in DataFrame format for direct use in modeling, visualization, or statistical analysis.
Adapting to API Changes
As APIs evolve, pandas-datareader adapts with community contributions and patches—helping you avoid broken code due to external changes.
Supported Data Sources (2025)
- Financial Markets: Yahoo Finance (unstable), Alpha Vantage, IEX Cloud, Stooq
- Economic Indicators: FRED (U.S. Federal Reserve), World Bank, OECD
- Other: Nasdaq Trader, Tiingo, Quandl (partially paid), Naver Finance (Korea)
Installation
pip install pandas-datareaderSample Code Examples
Naver Finance
import pandas_datareader.data as web

def get_pandas_naver_data(id, start, end):
    return web.DataReader(id, "naver", start=start, end=end)
Stooq
def get_pandas_stooq_data(id, start, end):
    return web.DataReader(id, "stooq", start=start, end=end)
FRED
def get_pandas_fred_data(id):
    return web.get_data_fred(id)
Example Main Script
import datetime as dt

if __name__ == "__main__":
    df = get_pandas_naver_data('005930', '2025-01-01', '2025-01-20')
    print(df.head())

    start_date = dt.datetime(2025, 1, 1)
    end_date = dt.datetime(2025, 1, 20)

    df = get_pandas_stooq_data('AAPL', start_date, end_date)
    print(df.head())

    df = get_pandas_fred_data("UNRATE")
    print(df.head())
Final Thoughts
Whether you’re building a stock screener, macroeconomic dashboard, or forecasting model, pandas-datareader is an essential tool that bridges the gap between Python and the world of real-time financial data. With just a few lines of code, you can connect to powerful data sources and begin your analysis without reinventing the wheel.
As the financial data landscape continues to evolve, having a flexible and well-supported library like pandas-datareader in your workflow is more valuable than ever.
Let me know if you’d like this turned into a Markdown file, included in a blog platform (like Hugo, WordPress, or Jupyter Book), or visualized with charts and graphs for educational content!
Real-World Applications: How Is pandas-datareader Used in Practice?
pandas-datareader is more than just a data retrieval tool.
In real-world projects, it’s a core part of the data pipeline—used in everything from cleaning and analysis to visualization and predictive modeling.
1. Automating Financial Research
Whether you’re building quantitative investment reports or performing macroeconomic analysis, you’ll likely need to pull data on a regular basis—such as stock prices, interest rates, or inflation indicators.
Here’s an example workflow that can be fully automated:
- Pull U.S. 10-year treasury yields, unemployment rate (UNRATE), and S&P 500 index data from FRED
- Calculate technical indicators like moving averages or volatility
- Create visualizations using
matplotliborseaborn - Export daily or weekly reports to PDF and send them via email
With pandas-datareader, 90% of the data acquisition process is simplified.
You don’t need to manually scrape sites or manage authentication—just a few lines of code are enough.
2. Building Training Data for Machine Learning Models
When developing models to forecast stock prices or macroeconomic trends, reliable time series data is critical.
For example, to train a predictive model for a company’s stock:
- Retrieve historical stock prices (via Stooq or Alpha Vantage)
- Pull macroeconomic features like interest rates, employment, and consumer spending (via FRED)
- Get exchange rates or inflation from World Bank or OECD
You can then merge these into a single DataFrame, handle missing values, and engineer features for training.
3. Integration with External Services
pandas-datareader also works well with popular APIs and dashboards:
- Use it with Dash or Streamlit to create live financial dashboards
- Integrate into Flask or FastAPI apps for real-time analytics
- Automate Excel reporting using
openpyxlorxlsxwriter
From small-scale analysis tools to enterprise-grade reporting systems, pandas-datareader is incredibly versatile.
Tips for Data Quality and Stability
- Yahoo Finance is often unstable or blocked—consider using alternatives like Stooq, Naver, or FRED.
- Confirm each source’s identifier (ticker/code) using official docs or provider websites.
- Pay attention to data frequency (daily/weekly/monthly) as it varies by provider.
- For long-term economic trends, FRED and the World Bank are among the most stable and trusted sources.
pandas-datareader isn’t just a starting point—
it’s a powerful engine that simplifies complex analytics from the ground up.
Whether you’re working on automation, forecasting, visualization, or academic research,
pandas and its ecosystem remove the barriers between you and the data.
Once your idea is ready, the data is just a few lines of code away.
