Visualization plays a crucial role in data analysis, as it helps present numerical data in a more intuitive and understandable way. Python’s Matplotlib (Library Documentation) is one of the most widely used libraries for data visualization.
Matplotlib makes it easy to generate various visual representations, including graphs, charts, and plots. It supports everything from simple line graphs to more complex visualizations like histograms, scatter plots, and pie charts.
Additionally, Matplotlib offers detailed graph styling options, allowing users to create professional-quality visualizations. It integrates seamlessly with NumPy and other data processing libraries, making it particularly valuable for scientific computing and data analysis.
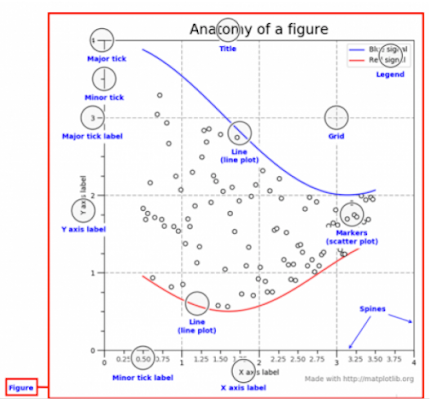
This image provides a summary of key terms used in Matplotlib and is available on the official website.
Matplotlib Code
# pip install -U matplotlib

import numpy as np
import matplotlib.pyplot as plt

plt.title("Drawing Multi-Line Graphs")

x = [0, 1, 2, 3, 4, 5]
y = [1, 2, 4, 6, 8, 10]
plt.plot(x, y, '.-', color = 'black' , label = 'meaning')

t = np.arange(0., 5., 0.2) # [0., 0.2, 0.4, 0.6, ..., 4.6, 4.8]
plt.plot(t, t, '.--', label="linear", color='red')
plt.plot(t, t ** 2, 'o-.', label="square", color='blue')
plt.plot(t, t ** 3, '*:', label="cubic", color='green')

plt.xlabel('x-label')
plt.ylabel('y-label')

plt.axis([0, 5, 0, 20])
plt.legend()

plt.show()
I didn’t initially think visualization was that important.
However, after analyzing various datasets, I realized how much valuable insight can be gained through visualization. That’s why I decided to take another look at this library.
Charts are the most common form of visualization, but other techniques—such as image maps or text clouds—can also be highly effective.
That said, data cleaning is crucial before visualization. I might sound a bit radical, but I firmly believe that garbage in, garbage out—meaning, unprocessed data won’t yield meaningful results. Pre-processing data with a clear purpose is essential to extract real value from it.
In the future, I plan to write a post about how I’ve benefited from data analysis (excluding any company names). However, since each topic is relatively small, I might bundle them into a single post.

