Image Map – Visualizing Image Data with imshow
The imshow function is used to visualize image data and is primarily designed to display two-dimensional arrays as images.
To use it, simply pass an array of image data to imshow(). The function provides various color maps and interpolation options, allowing you to display images in different styles.
For example:
- Use the
cmapargument to set the color map. - Use the
interpolationargument to control how the image is rendered.
This makes imshow() a powerful tool for visualizing heatmaps, grayscale images, and other data-based visualizations.
Pros of Using imshow
- Simplicity
- Easily visualize two-dimensional arrays as images.
- Convenient for data analysis and processing.
- Flexibility
- Offers various color maps and interpolation options to customize image representation.
- Extensibility
- Can visualize not only images but also complex data structures.
- Useful in scientific research and engineering analysis.
Key Use Cases
- Scientific Research
- Represent and analyze experimental data as images.
- Used in fields like physics, chemistry, and biology.
- Machine Learning
- Process image data and visualize results.
- For example, display feature maps from convolutional neural networks (CNNs) to understand network behavior.
- Geographic Information Systems (GIS)
- Visualize satellite imagery or terrain data.
imshow is a powerful tool for converting numerical data into meaningful visual representations across various fields.
Image map Code
import matplotlib.image as img
import matplotlib.pyplot as plt
import numpy as np

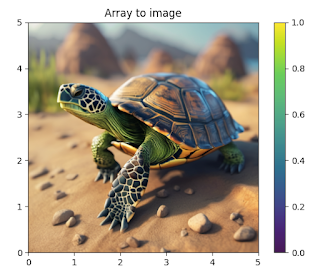
image = img.imread('./imshow.png')
# image array
# [[[0.9372549  0.9254902  0.89411765]
#   [0.91764706 0.92941177 0.89411765]
#   [0.9137255  0.93333334 0.8901961 ]
#   ...
plt.imshow(image, cmap='viridis')
plt.colorbar()
plt.title('Array to image')
plt.show()
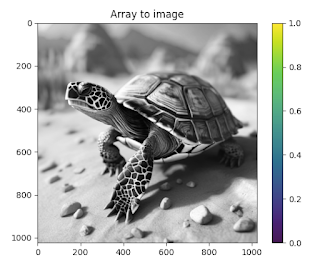
# Color Gray
plt.imshow(image[:,:,[0,0,0]], cmap='viridis')
plt.colorbar()
plt.title('Array to image')
plt.show()
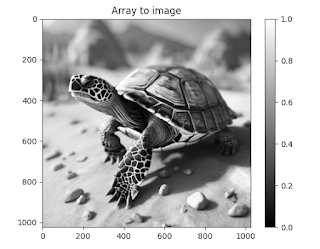
# Gray Channel
plt.imshow(image[:,:,0], cmap='gray')
plt.colorbar()
plt.title('Array to image')
plt.show()
First of all, I wrote this case as an example of color modification. In reality, I needed to extract text from an image using OCR (Optical Character Recognition) to read a children’s storybook to my kids.
I had heard that preprocessing an image before OCR improves recognition accuracy, so I gave it a try. Interestingly, the older version of the OCR software could recognize the text more effectively after preprocessing.
I wonder if modern OCR technology would still benefit from preprocessing or if it would work just as well without it.
After this experience, I started paying more attention to data source quality and optimization, realizing how crucial they are for accurate results.

.jpeg)